Skip to content

Knowledge

Side-Channel Analysis – Security Chips Put to the Test by TÜV

Side-channel analysis is a key component of security chip testing. In this article, we explain how communication relates to this, provide a clear explanation of how the analysis works, and highlight the role TÜV plays in the process.

Contact Us
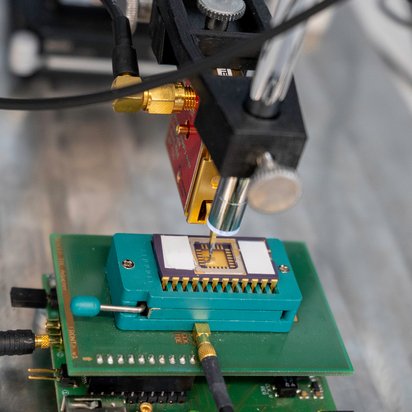
Seitenkanalmessung eines Infineon Smartcard Chips mithilfe elektromagnetischer Abstrahlung (EMA). Der Tastkopf der Langer ICR Messsonde ist exakt über der Oberfläche des Chips mit einer Mikroskopkamera positioniert.
Essen | 27 July 2026

What is a Side Channel?

Side channels are not a discovery of the information age, but have existed for as long as humankind has. Side channels are, in fact, not just a phenomenon of modern technical communication, but of all forms of communication, even those that do not involve any technical aids at all. They are distinguished from the direct communication channel shared by a sender and a receiver for the purpose of exchanging information. To take an everyday example, imagine two people trying to arrange a meeting. One person suggests a time and asks whether it suits the other person. Although the latter agrees, the former realises from the other person’s body language that the time does not actually suit them. Body language – a side channel – is, like the spoken word, part of human communication. The human system cannot help but reveal additional information in this way. In communication psychology, this is referred to as Schulz von Thun’s four-channel model, which states that the direct communication channel operates at the factual level, whilst the side channel resembles an (unconscious) self-revelation.

The Technical Side Channel

The same applies to technical information systems. As a rule, a data channel – the direct communication channel – connects one information system to another. But here, too, there is a kind of ‘body language’ that stems from the technology used. The heart of these information systems – usually the processors, or CPUs – is based on a key semiconductor process known as CMOS technology. Processors using this technology vary their power consumption depending on the bits and bytes that represent the communication data. This variable power consumption can be measured, allowing conclusions to be drawn about the data and thus constituting a side channel. Just as in the human example given above, this too results in an unconscious self-revelation. The information system has no choice in the matter.

Implications for IT Security

Semiconductor chips for the IT security sector are no exception. They are used in identity cards, passports, debit cards, laptops, mobile phones, secure government radio communications, point-of-sale systems, digital logbooks and much more. In short: they form the digital foundation of trust for a modern society, all the more so in the current challenging global climate with ever-increasing cyber threats.

To ensure that important information and data – such as cryptographic keys or personal data – stored on the chips are not compromised via side-channel attacks, scientifically sound and now largely professionalised testing methods have been established to determine whether a chip is adequately protected.

Side-Channel Analysis

When we talk about side-channel analysis of semiconductor chips, we are referring to a method in which the chip’s varying power consumption is examined in order to obtain information about the secrets being processed within the chip. This method is used both by attackers and by testing laboratories such as TÜVIT to examine chips as part of various IT security tests.

A chip is constantly supplied with a constant voltage, e.g. 5V in the case of a debit card inserted into a card reader. Depending on the complexity of the processing steps or the data being processed, the chip requires more electrical power, which leads to an increase in the current supplied whilst the voltage remains constant.

To measure this time-varying process, the current is measured using an oscilloscope via a resistor that must first be inserted into the chip’s power supply. An oscilloscope is a measuring instrument capable of measuring voltages with very high temporal resolution – up to several tens of billions of times per second. According to Ohm’s law, the voltage drop across the resistor varies over time in line with the chip’s changing current demand. The oscilloscope records precisely this voltage drop – also known as a trace – for subsequent analysis.

Electromagnetic Emissions as a Second Side Channel

In addition to measurement via a resistor, the electromagnetic radiation – a second side channel – from the chip has become established. For this purpose, a measuring probe positioned directly above the chip’s surface is used to measure the electromagnetic field generated by the chip.

This field arises because currents flow through many tiny conductive tracks inside the chip. Through electromagnetic induction, the measuring probe in turn converts the field into a voltage. The advantage of this side channel is that, by precisely positioning the measuring probe above a specific processing unit of the chip, only relevant variable currents can be measured. This is because only a specific part of the chip is processing the secret in question at any given time.

Two Fundamental Principles of Analysis

All known analysis methods applied to measurement signals or traces essentially follow two fundamental principles, which were established by two groundbreaking research papers published in 1996 and 1999.

Timing Analysis: Extracting secrets from runtime behaviour

In the first paper, secrets are extracted indirectly via the runtime behaviour of algorithms, which is significantly influenced by the secrets. The most prominent example of such a side-channel analysis was the attack on the RSA cryptosystem. RSA encrypts messages using a key via modular exponentiation. Put simply, a message m is raised to the power of the key d, i.e. m to the power of d is calculated. A crucial aspect here is that the computational algorithm, as implemented around 1996, processes the key by breaking it down into its bit representation. If the bit currently being processed is a 0, a squaring operation is performed mathematically; if it is a 1, a squaring operation is performed followed by a multiplication. Simply by examining the corresponding trace, it was quickly established that processing a 1 took longer, as the additional multiplication—which is also computationally intensive—caused the fluctuating current demand to remain elevated for a fraction of a second longer. The secret key d could thus be easily read off.

Differential Power Analysis: Detecting statistical differences

In the second publication, Differential Power Analysis (DPA) was developed. Today, DPA is an umbrella term for various statistical methods that enable the distinction of secrets in measurement data. The study was carried out using the Data Encryption Standard (DES) as an example, but can also be applied to its successor, the Advanced Encryption Standard (AES).

AES as an example
of application AES is a specification for an encryption algorithm that uses a key to encrypt a message through a series of mathematical operations. The AES key is very large, at 128 bits. It is impossible to try out all possible combinations. However, according to the specification, the individual operations always process only 8 bits of the key and the message at a time. This can be exploited as follows: the key and the message are divided into 16 blocks of 8 bits. If one focuses exclusively on the first 8 bits, one calculates the operations up to a self-selected intermediate value, assuming all possible sub-keys divided in this way. Note that for 8 bits, there are only 2 to the power of 8, i.e. 256, sub-keys, in stark contrast to the far greater number of possibilities for the entire 128-bit key. Only a single sub-key is the correct one, which is used by the chip. However, this also means that the traces contain information only about this very key – or, to be precise, about the intermediate value calculated from it and previously selected by the user.

Sorting and comparing the measurement data
For the proposed ‘difference-of-means’ analysis technique to be successful, several measurements must be carried out, ensuring that the same (sub)key is used each time, but with different messages. In the following analysis, the individual traces are sorted into even and odd values based on the calculated intermediate values. Depending on the 256 sub-keys, each trace is sorted with regard to a specific sub-key into two ‘pools’: an ‘even pool’ and an ‘odd pool’. Only the correct sub-key will always sort each individual trace into the correct pool.

Determining the complete key
If there is a measurable difference between even and odd values in the traces, the mean values of the measured values sorted into the pots should also differ for the correct sub-key. To simplify matters, let us assume that even values are measured at 0 volts and odd values at 1 volt. With the correct key, the mean values will be distinguishable at 0 volts and 1 volt; with the incorrect keys, however, they will be indistinguishable at 0.5 volts and 0.5 volts. This procedure is repeated 16 times, and the sub-key that shows a difference of 1 volt in the mean value is always selected. When combined, these now form the complete 128-bit key.
The TÜVIT Hardware Laboratory

Would you like to find out more about our expertise and services relating to our state-of-the-art hardware laboratory? If so, please follow the link.

Do you Have any Questions?

We're happy to help!
Timo Bartkewitz, TÜV Informationstechnik

Dr. Timo Bartkewitz

Team Lead Security Assessment and Testing
Nick Theisejans, TÜV Informationstechnik

Nick Theisejans

Productmanager Hardware Security